Advanced WordPress Debugging: How to Find What's Decimating Your Site Speed
Welcome to Part 4 of our five-part series on building a lightning-fast WordPress website. We’ve already covered the foundational steps (Part 1), dove into advanced server-side optimizations (Part 2), and mastered the critical rendering path (Part 3). You’ve implemented all the best practices, but what happens when your site still feels sluggish, and you can’t figure out why?
This is where advanced WordPress debugging comes in. Debugging is the process of finding and fixing errors or performance bottlenecks. For the average website manager, this can sound like a job for a developer, but with the right tools and a systematic approach, you can become a detective for your own website. This guide will empower you to go beyond guesswork and use professional-grade techniques to pinpoint the exact issues slowing your site down. If you would rather hand it off, our website maintenance team can do the detective work for you.
The First Step: Enabling WordPress’s Built-in Debug Mode
Before you install any plugins or open complex tools, you should activate WordPress’s own powerful debugging system. This is a crucial first step in advanced WordPress debugging that can reveal a wealth of hidden information.
By default, WordPress hides all PHP errors, warnings, and notices from public view to prevent a bad user experience. While this is good for a live site, it makes troubleshooting nearly impossible. To enable it, you need to edit your site’s wp-config.php file.
How to Enable WP_DEBUG
- Access your site’s files using an FTP client or your host’s file manager.
- Locate the wp-config.php file in your site’s root directory.
- Open the file and find the line that says define( ‘WP_DEBUG’, false );.
- Change false to true.
- Bonus Tip: To avoid displaying errors on your live site (which can be a security risk), add these two lines right below it:
- define( ‘WP_DEBUG_LOG’, true ); (This saves all errors to a debug.log file in the wp-content folder).
- define( ‘WP_DEBUG_DISPLAY’, false ); (This prevents errors from showing up on the front end).
Once enabled, you can check the debug.log file for a detailed record of every error, warning, or notice. This is invaluable for identifying plugin conflicts, deprecated functions, and other issues that might be slowing down your site.
The Developer’s Best Friend: The Browser’s Developer Tools
Every modern web browser comes with a suite of incredibly powerful debugging tools. You don’t need to be a developer to use them effectively for advanced WordPress debugging.
The Network Tab
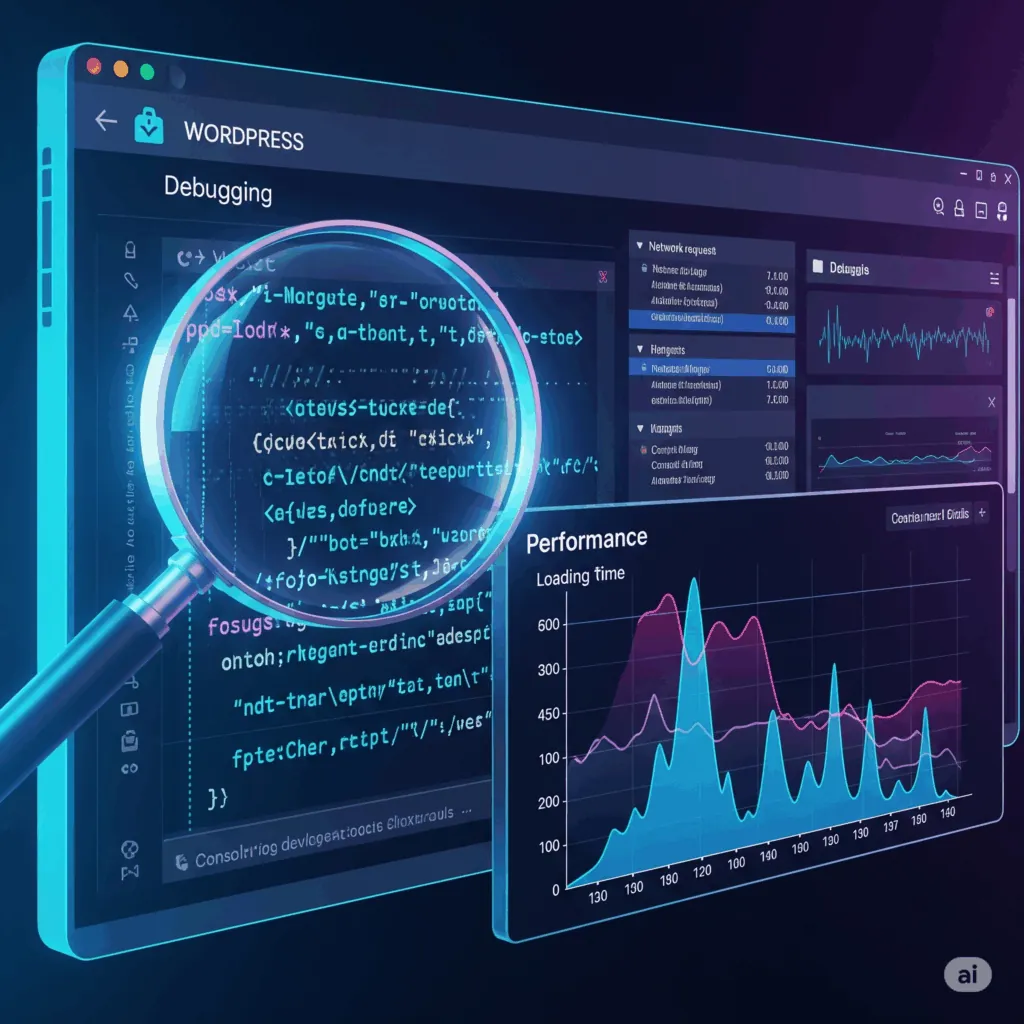
This is your go-to tool for performance analysis. It shows every single file your website loads (HTML, CSS, JavaScript, images, etc.), how long each one takes to download, and its size. This can help you identify:
- Large Files: If a single image or JavaScript file is taking a long time to load, you know where to focus your optimization efforts.
- Too Many Requests: If your site is making hundreds of requests, it will be slow. The Network tab helps you see which plugins or scripts are adding the most requests.
- Render-Blocking Resources: You can see which files are preventing the page from rendering quickly, which ties directly back to our discussion on the Critical Rendering Path in Part 3.
The Performance Tab
This is a more advanced WordPress debugging tool that records a timeline of your site’s loading process. It can show you exactly what the browser is doing at every millisecond-from scripting and rendering to painting. This helps you find bottlenecks in your code and identify where the browser is spending the most time. If the numbers point back to your server rather than your code, it may be time to move to fast local hosting.
The WordPress Detective: The Query Monitor Plugin
While the built-in WP_DEBUG is great, it can be overwhelming for a beginner. This is where a powerful, free plugin like Query Monitor comes in. It’s a must-have for any website manager serious about advanced WordPress debugging.
Query Monitor adds a new menu to your WordPress admin bar that provides a wealth of information in a clean, easy-to-read format. It helps you:
- Identify Slow Database Queries: It shows you every single database query that runs on a page, how long it took, and which plugin or theme function called it. This is a game-changer for finding inefficient code.
- Find PHP Errors and Warnings: It presents all PHP errors and warnings in a much more user-friendly way than the raw debug.log file.
- Analyze Enqueued Scripts and Stylesheets: It shows you every single CSS and JavaScript file loading on a page, helping you identify and remove unnecessary assets.
- Check HTTP API Calls: It reveals any external API calls your plugins are making, which can be a major source of performance issues.
The Systematic Approach: An Advanced WordPress Debugging Checklist
Now that you have the tools, here is a simple, step-by-step checklist for advanced WordPress debugging:
Step 1: Start with the Browser
Open your site in an incognito window and check the Network tab in your browser’s developer tools. Look for any red flags: large files, long load times, or an excessive number of requests.
Step 2: Enable WP_DEBUG
Activate the WP_DEBUG_LOG and WP_DEBUG_DISPLAY constants in your wp-config.php file to start logging errors.
Step 3: Install Query Monitor
Activate the plugin and navigate to the page you want to debug. Look for any red warnings in the admin bar. Dive into the database queries section to find any queries taking longer than 0.1 seconds.
Step 4: Check for Plugin/Theme Conflicts
A common cause of problems is a conflict between plugins or between a plugin and your theme. To check for this, temporarily deactivate all your plugins and switch to a default theme like Twenty Twenty-Four. If the problem disappears, you know it’s a conflict. Reactivate them one by one to find the culprit.
Step 5: Review the Debug Log
Go to your wp-content folder and open the debug.log file. Look for any repeating errors or warnings, as these often point to a core issue.
For more information on these tools and techniques, check out this great guide on WordPress Debugging Tools That Find Errors in Minutes. If debugging keeps eating your week, our monthly SEO maintenance and care plans keep your site fast and healthy year-round.
What’s Next?
By using these advanced WordPress debugging techniques, you can confidently find and fix performance issues on your site. This is a skill that will save you time and money and help you maintain a fast, healthy website.
This concludes the fourth part of our series. In the final installment, we bring all the concepts together into a comprehensive, holistic WordPress performance strategy that will serve as your roadmap for the future.
Need a Fast, Professional WordPress Website?
JWD Website Design builds high-performance WordPress websites for South African businesses. We handle the setup, speed optimisation, security, and ongoing maintenance so you can focus on running your business. Browse our website design packages in the shop or get a free quote and we’ll help you build a site that loads fast from day one.
Related reading: How to Speed Up WordPress Fast 2025 • Advanced Server Optimisation • Mastering the Critical Rendering Path • Complete WordPress Optimisation Strategy • WordPress Maintenance SA • WordPress On-Page SEO
Frequently Asked Questions
How do I enable debug mode in WordPress?
Open your wp-config.php file in the site’s root directory using an FTP client or your host’s file manager. Find the line define( ‘WP_DEBUG’, false ); and change false to true. To keep errors off your live front end, add define( ‘WP_DEBUG_LOG’, true ); to save errors to a debug.log file, and define( ‘WP_DEBUG_DISPLAY’, false ); to stop them showing publicly.
Where does WordPress save the debug log file?
Once you have set WP_DEBUG_LOG to true, WordPress saves every error, warning and notice to a debug.log file inside the wp-content folder. You can open this file to review a detailed record of issues, which is invaluable for spotting plugin conflicts, deprecated functions and other problems that might be slowing your site down.
What is Query Monitor and what can it tell me?
Query Monitor is a powerful, free WordPress plugin that adds a menu to your admin bar with clear, easy-to-read diagnostics. It identifies slow database queries and which plugin or theme called them, presents PHP errors and warnings in a friendly way, analyses every enqueued script and stylesheet, and reveals external HTTP API calls your plugins make.
How do I find a plugin or theme conflict slowing my site?
Temporarily deactivate all your plugins and switch to a default theme like Twenty Twenty-Four. If the problem disappears, you know it is a conflict. Then reactivate your plugins one by one until the issue returns, which pinpoints the culprit. This is a common cause of WordPress performance problems.
Which browser tool shows what files are slowing my page down?
Use your browser’s Network tab in the developer tools. It shows every file your site loads, how long each takes to download and its size, helping you spot large files, an excessive number of requests, and render-blocking resources. The Performance tab goes further, recording a timeline of scripting, rendering and painting to find bottlenecks.